
Identity area
Reference code
Title
Date(s)
Level of description
Extent and medium
1 digital image
Context area
Archival history
Immediate source of acquisition or transfer
Content and structure area
Scope and content
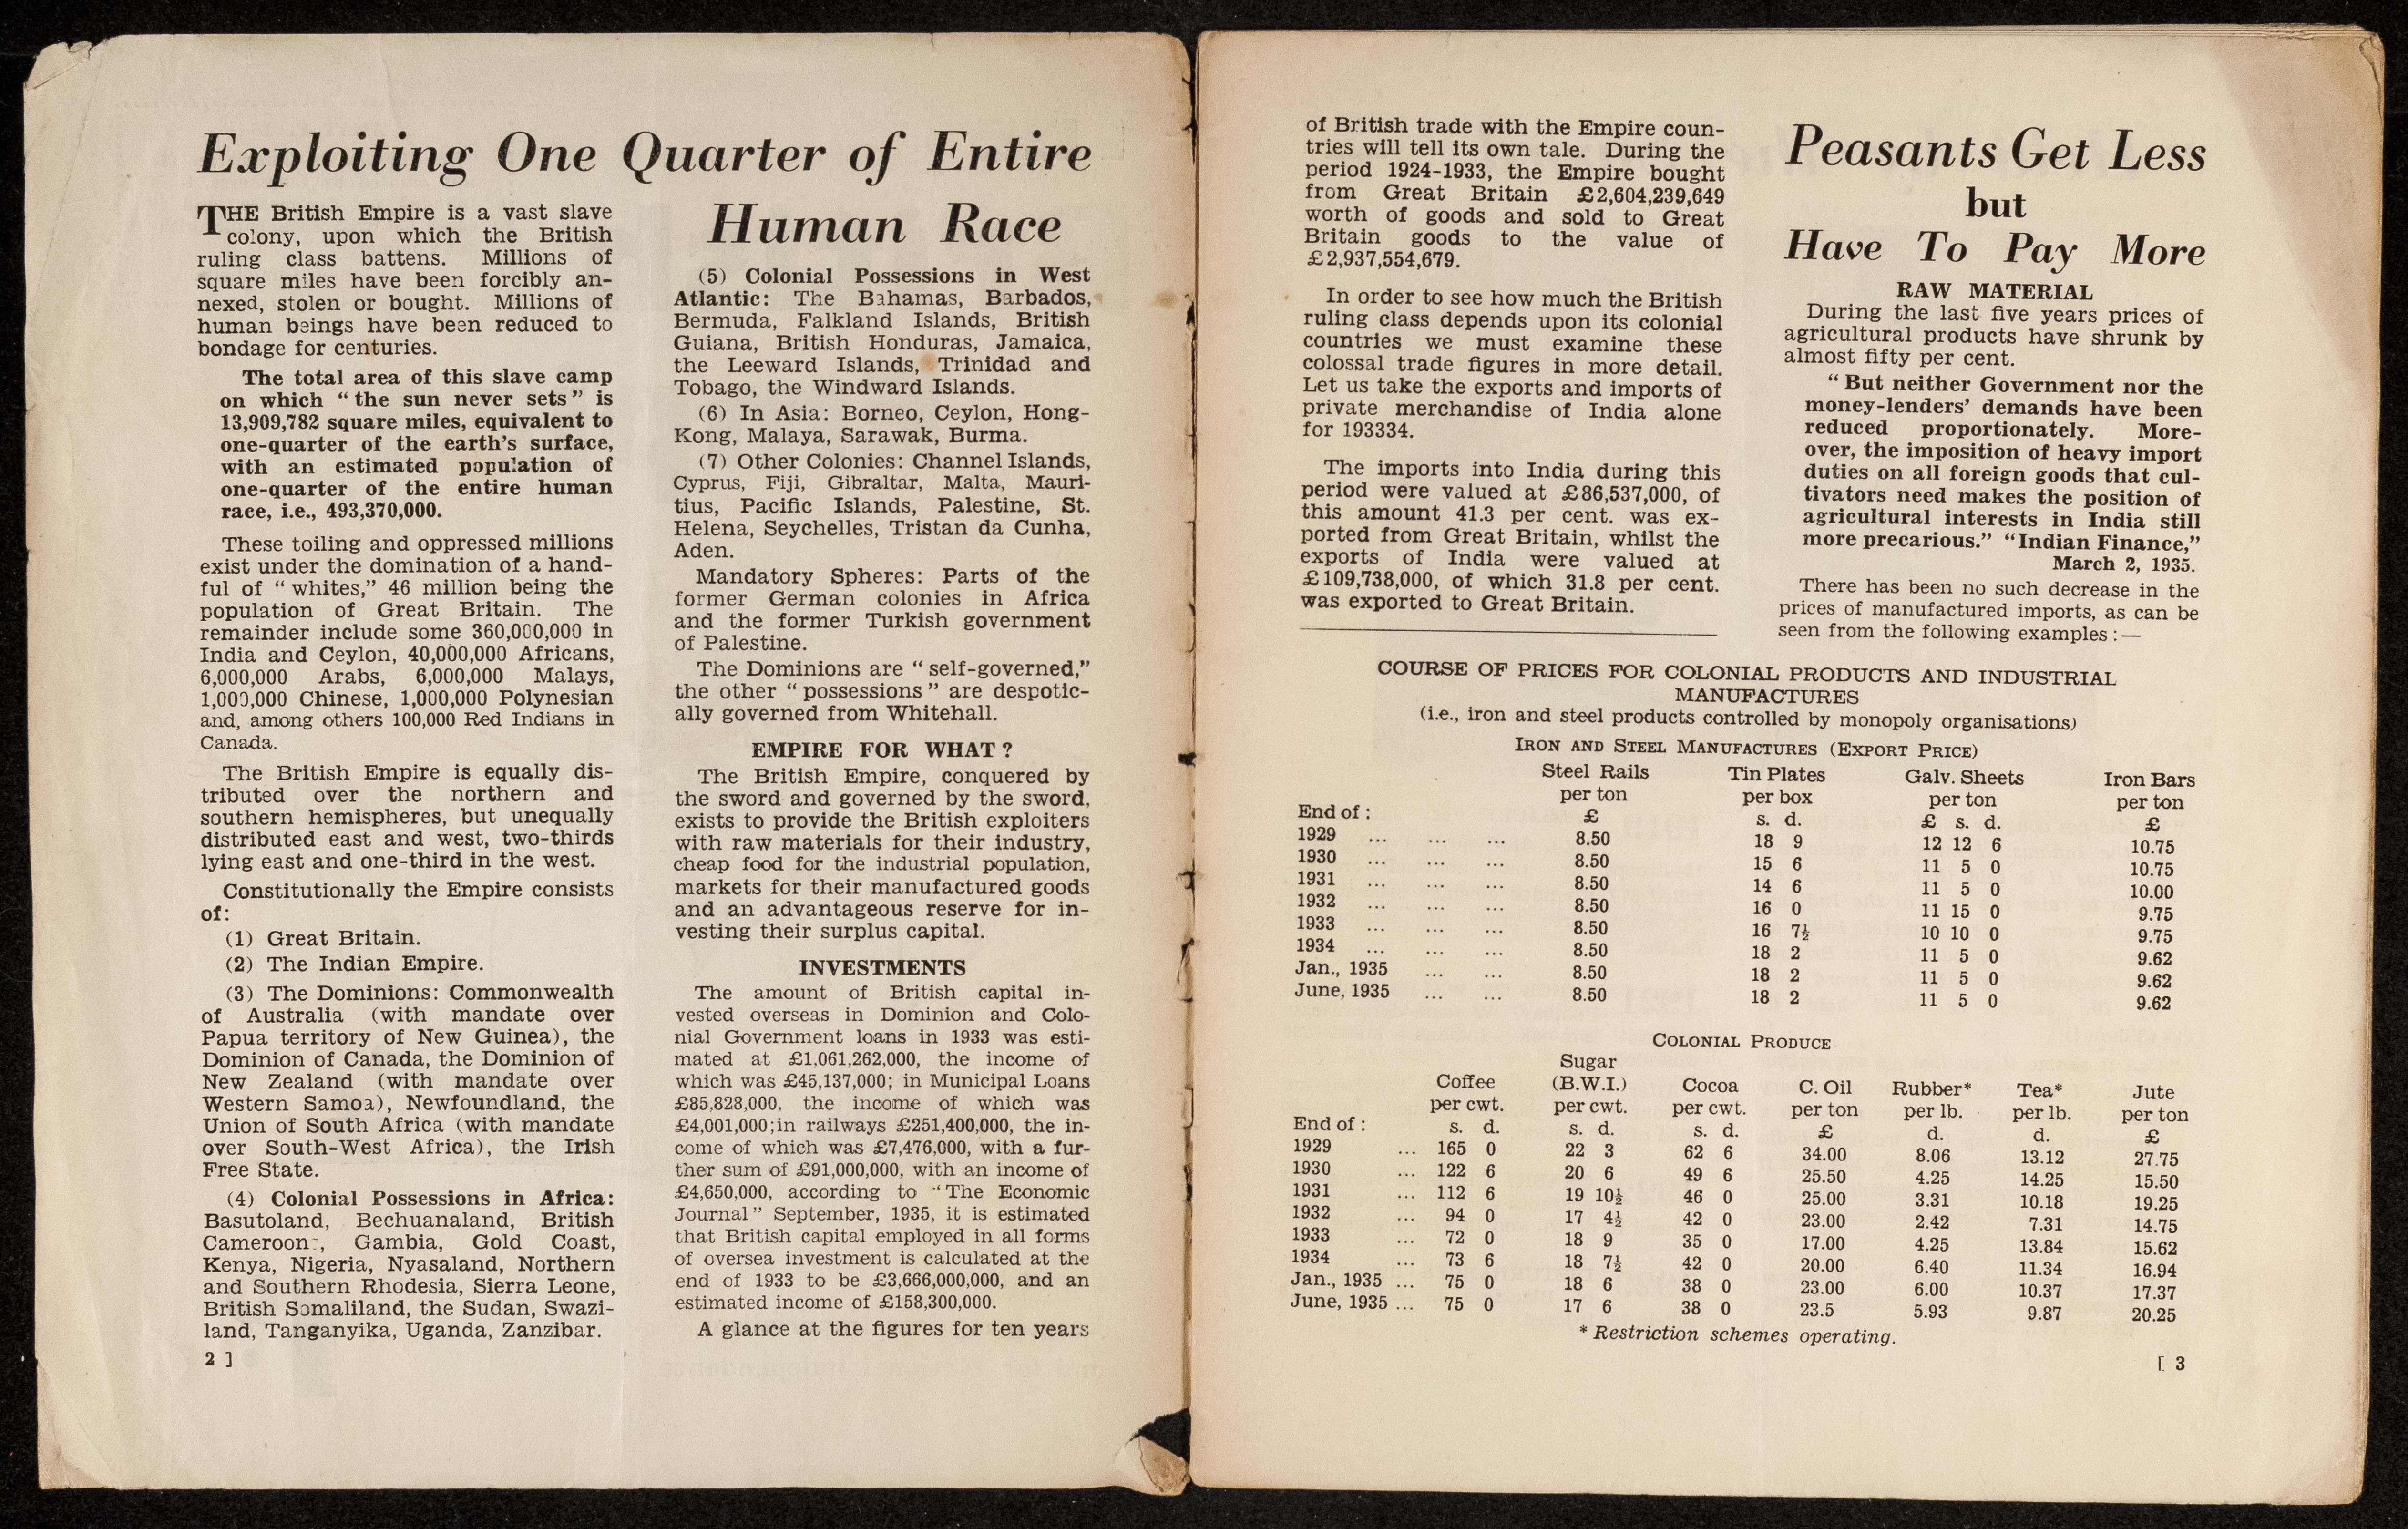
Exploiting One Quarter of Entire THE British Empire is a vast slave colony, upon which the British ruling class battens. Millions of square miles have been forcibly an- nexed, stolen or bought. Millions of human beings have been reduced to bondage for centuries. The total area of this slave camp on which "the sun never sets" is 13,909,782 square miles, equivalent to one-quarter of the earth's surface, with an estimated population of one-quarter of the entire human race, i.e., 493,370,000. These toiling and oppressed millions exist under the domination of a hand- ful of "whites," 46 million being the population of Great Britain. The remainder include some 360,000,000 in India and Ceylon, 40,000,000 Africans, 6,000,000 Arabs, 6,000,000 Malays, 1,000,000 Chinese, 1,000,000 Polynesian and, among others 100,000 Red Indians in Canada. The British Empire is equally dis- tributed over the northern and southern hemispheres, but unequally distributed east and west, two-thirds lying east and one-third in the west. Constitutionally the Empire consists of: (1) Great Britain. (2) The Indian Empire. (3) The Dominions: Commonwealth of Australia (with mandate over Papua territory of New Guinea), the Dominion of Canada, the Dominion of New Zealand (with mandate over Western Samoa), Newfoundland, the Union of South Africa (with mandate over South-West Africa), the Irish Free State. (4) Colonial Possessions in Africa: Basutoland, Bechuanaland, British Cameroon, Gambia, Gold Coast, Kenya, Nigeria, Nyasaland, Northern and Southern Rhodesia, Sierra Leone, British Somaliland, the Sudan, Swazi- land, Tanganyika, Uganda, Zanzibar. 2] Human Race (5) Colonial Possessions in West Atlantic: The Bahamas, Barbados, Bermuda, Falkland Islands, British Guiana, British Honduras, Jamaica, the Leeward Islands, Trinidad and Tobago, the Windward Islands. (6) In Asia: Borneo, Ceylon, Hong- Kong, Malaya, Sarawak, Burma. (7) Other Colonies: Channel Islands, Cyprus, Fiji, Gibraltar, Malta, Mauri- tius, Pacific Islands, Palestine, St. Helena, Seychelles, Tristan da Cunha, Aden. Mandatory Spheres: Parts of the former German colonies in Africa and the former Turkish government of Palestine. The Dominions are "self-governed," the other "possessions" are despotic- ally governed from Whitehall. EMPIRE FOR WHAT? The British Empire, conquered by the sword and governed by the sword, exists to provide the British exploiters with raw materials for their industry, cheap food for the industrial population, markets for their manufactured goods and an advantageous reserve for in- vesting their surplus capital. INVESTMENTS The amount of British capital in- vested overseas in Dominion and Colo- nial Government loans in 1933 was esti- mated at £1,061,262,000, the income of which was £45,137,000; in Municipal Loans £85,828,000, the income of which was £4,001,000;in railways £251,400,000, the in- come of which was £7,476,000, with a fur- ther sum of £91,000,000, with an income of £4,650,000, according to "The Economic Journal" September, 1935, it is estimated that British capital employed in all forms of oversea investment is calculated at the end of 1933 to be £3,666,000,000, and an estimated income of £158,300,000. A glance at the figures for ten years of British trade with the Empire coun- tries will tell its own tale. During the period 1924-1933, the Empire bought from Great Britain £2,604,239,649 worth of goods and sold to Great Britain goods to the value of £2,937,554,679. In order to see how much the British ruling class depends upon its colonial countries we must examine these colossal trade figures in more detail. Let us take the exports and imports of private merchandise of India alone for 193334. The imports into India during this period were valued at £86,537,000, of this amount 41.3 per cent. was ex- ported from Great Britain, whilst the exports of India were valued at £109,738,000, of which 31.8 per cent. was exported to Great Britain. Peasants Get Less but Have To Pay More RAW MATERIAL During the last five years prices of agricultural products have shrunk by almost fifty per cent. "But neither Government nor the money-lenders' demands have been reduced proportionately. More- over, the imposition of heavy import duties on all foreign goods that cul- tivators need makes the position of agricultural interests in India still more precarious." "Indian Finance," March 2, 1935. There has been no such decrease in the prices of manufactured imports, as can be seen from the following examples: - COURSE OF PRICES FOR COLONIAL PRODUCTS AND INDUSTRIAL MANUFACTURES (i.e., iron and steel products controlled by monopoly organisations) IRON AND STEEL MANUFACTURES (EXPORT PRICE) Steel Rails per ton £ End of: 1929 ... ... 8.50 1930 ... ... 8.50 1931 ... ... 8.50 1932 ... ... 8.50 1933 ... ... 8.50 1934 ... ... 8.50 Jan., 1935 ... ... 8.50 June, 1935 ... ... 8.50 Tin Plates per box s. d. 18 9 15 6 14 6 16 0 16 7½ 18 2 18 2 18 2 Galv. Sheets per ton £ s. d. 12 12 6 11 5 0 11 5 0 11 15 0 10 10 0 11 5 0 11 5 0 11 5 0 Iron Bars per ton £ 10.75 10.75 10.00 9.75 9.75 9.62 9.62 9.62 COLONIAL PRODUCE Coffee per cwt. s. d. End of: 1929 165 0 1930 122 6 1931 112 6 1932 94 0 1933 72 0 1934 73 6 Jan., 1935 75 0 June, 1935 75 0 Sugar (B.W.I.) per cwt. s. d. 22 3 20 6 19 10½ 17 4½ 18 9 18 7½ 18 6 17 6 Cocoa per cwt. s. d. 62 6 49 6 46 0 42 0 35 0 42 0 38 0 38 0 C. Oil per ton £ 34.00 25.50 25.00 23.00 17.00 20.00 23.00 23.5 Rubber per lb. d. 8.06 4.25 3.31 2.42 4.25 6.40 6.00 5.93 Tea per lb. d. 13.12 14.25 10.18 7.31 13.84 11.34 10.37 9.87 Jute per ton £ 27.75 15.50 19.25 14.75 15.62 16.94 17.37 20.25 [ 3 * Restriction schemes operating.
Appraisal, destruction and scheduling
Accruals
System of arrangement
Conditions of access and use area
Conditions governing access
Conditions governing reproduction
Language of material
Script of material
Language and script notes
Physical characteristics and technical requirements
Finding aids
Uploaded finding aid
Allied materials area
Existence and location of originals
full_reference_code